Your Home Just Got More Valuable

The National Association of Realtors just released a report covering the latest data on our national housing market. Many of the figures were staggering and surprising. The following charts summarize the biggest findings from the report.
.jpg)
Housing Supply Year-Over-Year: Last 12 Months: One of the more surprising data produced from National Association of Realtors was the giant leap in housing shortage from July to August. It showed that nationally we are experiencing an incredible 10% decrease in homes on the market. It could be reasoned that a lot of buyers scooped up a ton of inventory during the summer leaving August high and dry. This could also mean buyers are struggling to find their next dream home.
Click to enlarge
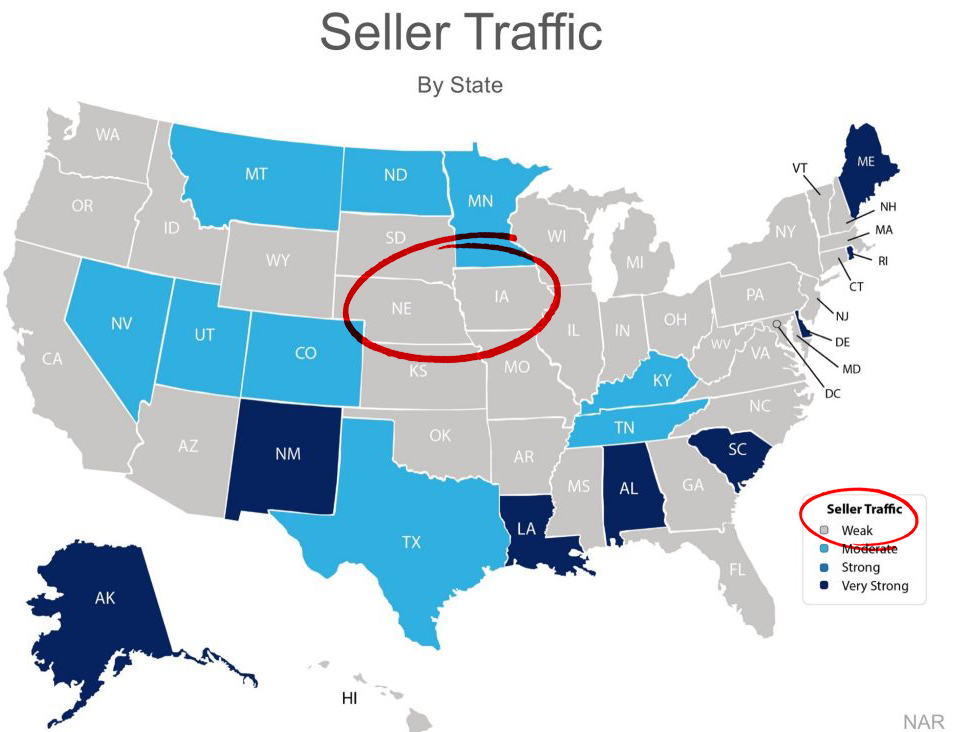
Seller Traffic By State: To breakdown the data and apply it to each state we can see just how many homes are listed for sale by state. Alaska, New Mexico, Maine and four other states are experiencing Very Strong seller traffic numbers which means there are more homes to choose from. However, Iowa and Nebraska and most of the nation do not share the same fate. Seller traffic is weak meaning that these housing markets are struggling and need more homes listed for sale.
Click to enlarge
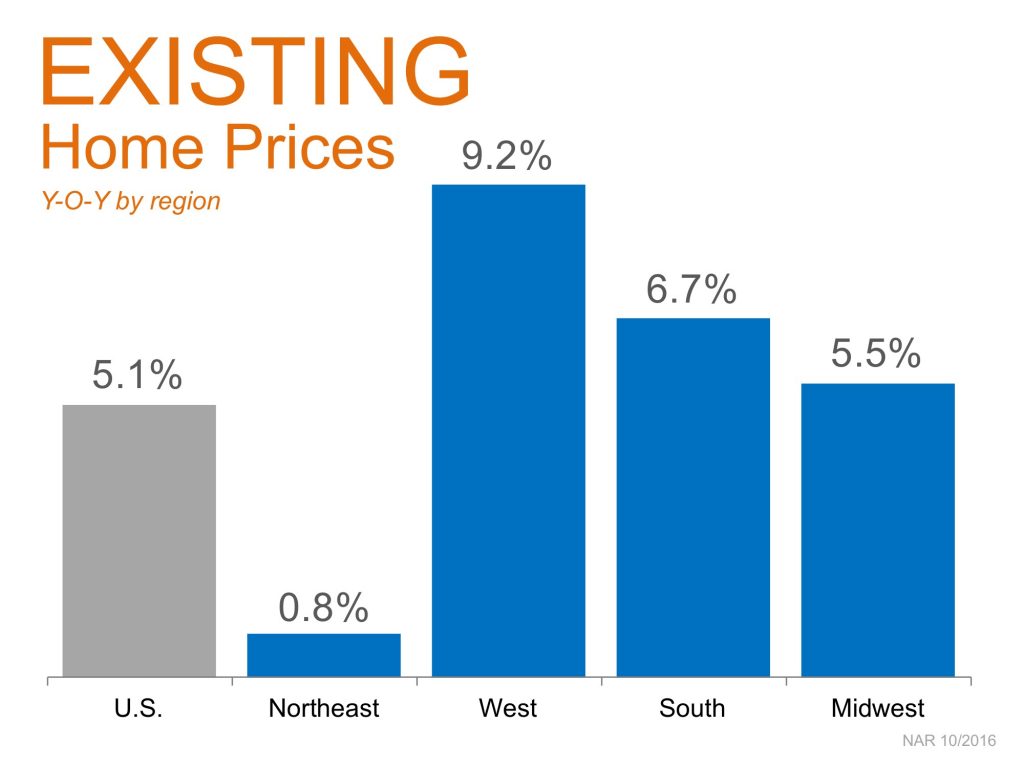
Existing Home Prices Year-Over-Year by Region: Nationally sellers are receiving 5.1% more for their homes this year versus last year. However, sellers in the Midwest are receiving 5.5% more on average.
Let’s break that down for our local real estate market:
Average home sold in Council Bluffs, Iowa since September 1: $145,615
On average, sellers are receiving $8,008 more this year versus last year
____________________________________________________________
Average home sold in Omaha, Nebraska since September 1: $199,374
On average, sellers are receiving $10,965 more this year versus last year
By the way, homes are selling for more and much faster as opposed to last year, with many having multiple offers in less than 48 hours.


.jpg)